
Cook-to-census workflow, survey ready
How to Fill Out Cook to Census Production Sheets in Senior Care
Scaling factors, disher sizes, holding temperatures, and leftover logs, field by field, so every signed sheet proves your kitchen followed the menu. Plans from $15/mo.
- Cook-to-census math
- CMS F-Tag F803
- FDA Food Code
- IDDSI textures
Lunch production sheet
- Pre-calculated census math
- Recipes and grocery lists
- Print-ready PDF
Herb baked chicken, 3 oz Base yield: 50
| Census | |
|---|---|
| Scaling factor | |
| Raw chicken | |
| Final temp | 168°F, 11:05 |
| Hot hold | 152°F, 11:30 |
| Cook | M.R. |
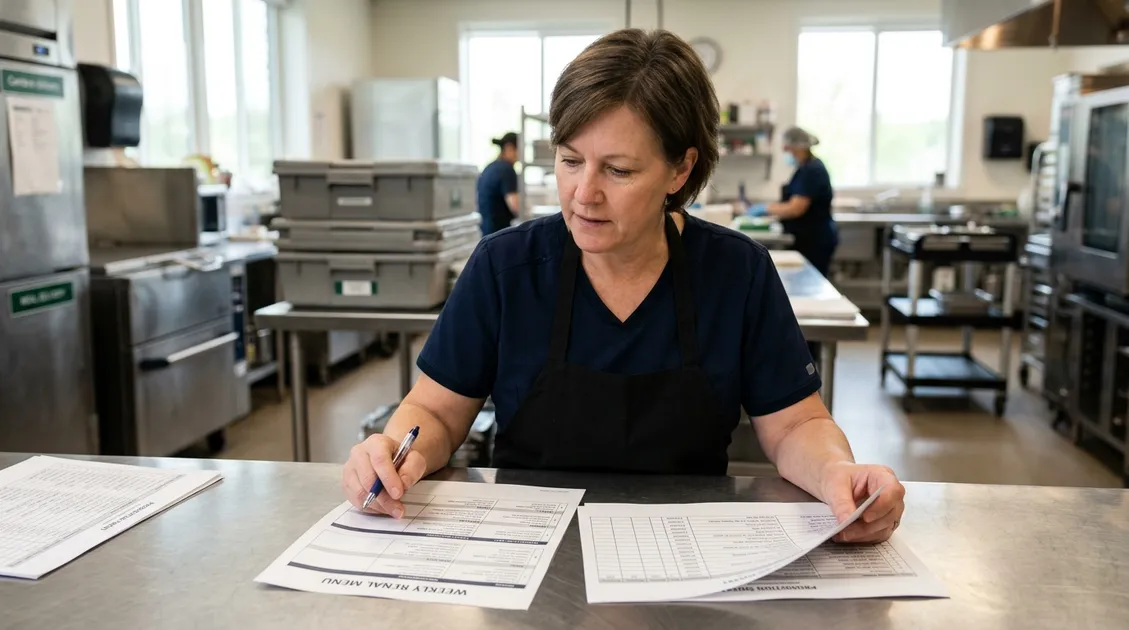
Cook to census production sheets tell cooks how much of each menu item to prepare for the day’s resident count, then record portions, temperatures, leftovers, and substitutions. This guide to filling out kitchen production sheets is part of PantryTec’s dietary operations guides.
TL;DR: A cook to census production sheet scales every recipe to today’s census: target portions ÷ base recipe yield = scaling factor. Cooks portion with numbered dishers (#8 = 1/2 cup, #12 = 1/3 cup, #16 = 1/4 cup), log temperatures, and record leftovers and substitutions, creating the record surveyors check under F803 and F812.
What Is a Cook to Census Production Sheet and Why Is It Mandatory?
A cook to census production sheet is the daily food production record that converts the resident count into batch quantities and portion sizes, and it becomes mandatory in practice because 42 CFR §483.60(c) requires menus that are prepared in advance and followed. PantryTec treats the sheet as the bridge between a dietitian-approved menu and the tray line. Each line lists a menu item, base recipe yield, portion count by diet order, scaling factor, and portion size, with space for temperatures, leftovers, and substitutions. While federal regulations for skilled nursing facilities (SNFs) enforce menu adherence through CMS F-Tag F803, assisted living and residential care communities (RCFEs) face similar recordkeeping mandates under their respective state licensing codes. According to the California HealthCare Foundation report Residential Care for the Elderly: Supply, Demand, and Quality Assurance, almost 800,000 Americans live in licensed supportive housing, where daily production documentation proves nutritional adequacy.
The Regulatory Link to CMS F803 and State Inspections
A December 2018 North Carolina survey cited F803 for lunch portions that differed from the planned menu, and the correction plan ordered more scoops, ladles, and spoodles. Temperature entries support F812, the food safety tag.
Stopping Raw Food Budget Bleed in Small Facilities
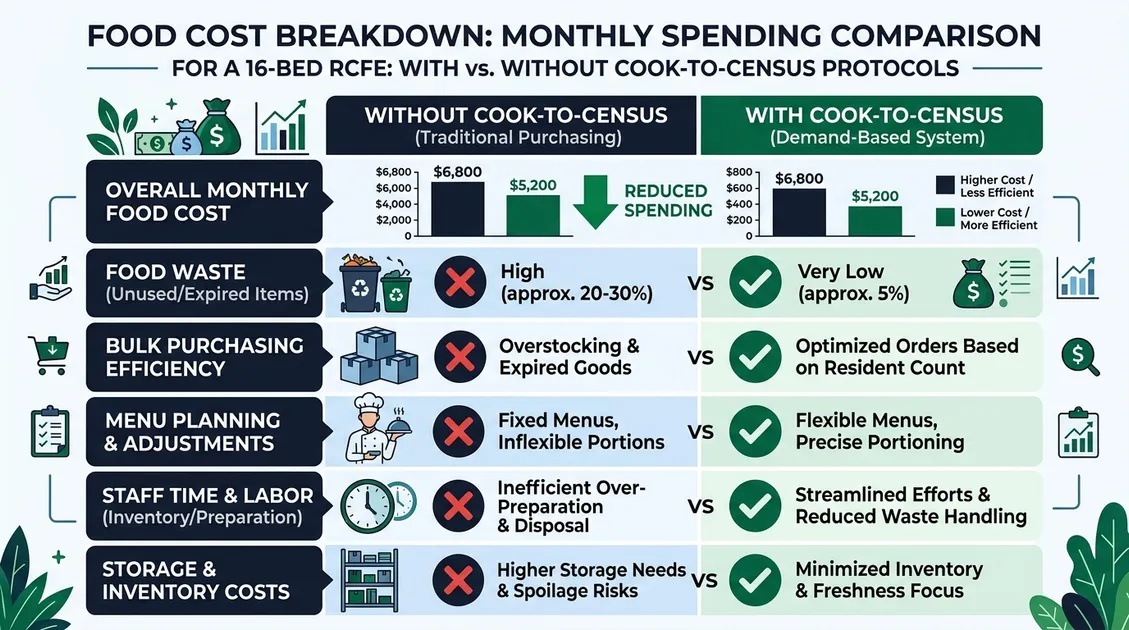
Raw food cost per resident day (PRD) climbs when batches outrun the census. I tell dietary managers to watch round numbers: prepping 70 portions for 64 residents overproduces by 9.4%. In the California HealthCare Foundation’s illustrative 60-unit profile (19.5% operating margin), software at $3 to $5 per resident per month costs $2,160 to $3,600 a year. PantryTec’s flat-rate plans start at $180 a year.
How Do You Calculate Recipe Scaling Factors for Daily Census Changes?
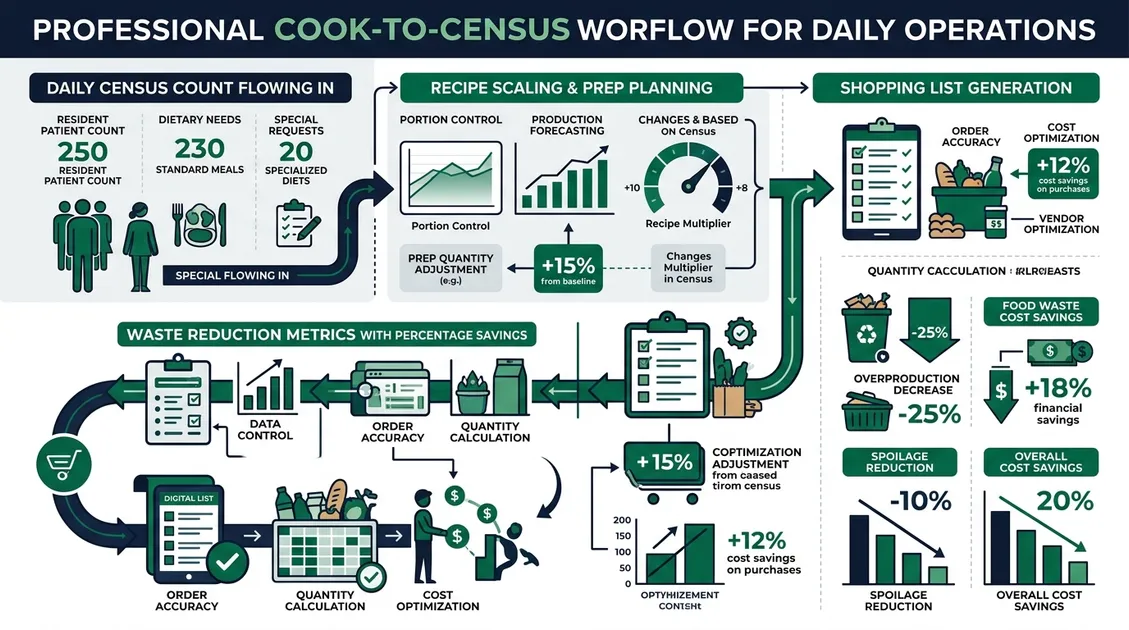
Recipe scaling factors equal target portions divided by base recipe yield, and cooks multiply every ingredient by that factor: a 50-portion recipe cooked for 64 residents runs at 1.28, so 13 lb of raw chicken becomes 16.75 lb after rounding. PantryTec pre-calculates this recipe yield scaling factor on every printed sheet, and cooks recheck it whenever the census changes after printing. The factor stays reliable only when the standardized recipe states its yield in portions of a defined size, such as 50 portions at 3 oz. Factors above 2.0 need a second check from the dietary manager, because seasonings, leavening, and cook times do not scale in a straight line. According to the California HealthCare Foundation report, its illustrative industry profile shows 50% annual resident turnover, so the census behind the math rarely holds for long.

The Yield Factor Formula Step-by-Step
- Write today’s portion count: census minus alternates, NPO orders, and absent residents (64).
- Copy the recipe’s base yield (50 portions).
- Divide: 64 ÷ 50 = 1.28.
- Multiply each ingredient: 13 lb chicken × 1.28 = 16.64 lb.
- Round up to a purchasable unit, in pen: 16.75 lb.
Adjusting for Non-Select Dining vs Alternate Entrees
Non-select dining serves the posted entrée to everyone without a documented preference, minus known alternates. Select dining scales each entrée to its pre-order count plus a set allowance, such as 2 per 50. Alternate entrées honor resident preferences and choices under F806, but must meet F803’s requirement for similar nutritive value and be documented on the same production sheet.
What Step-by-Step Fields Must Cooks Fill Out During Each Meal Shift?
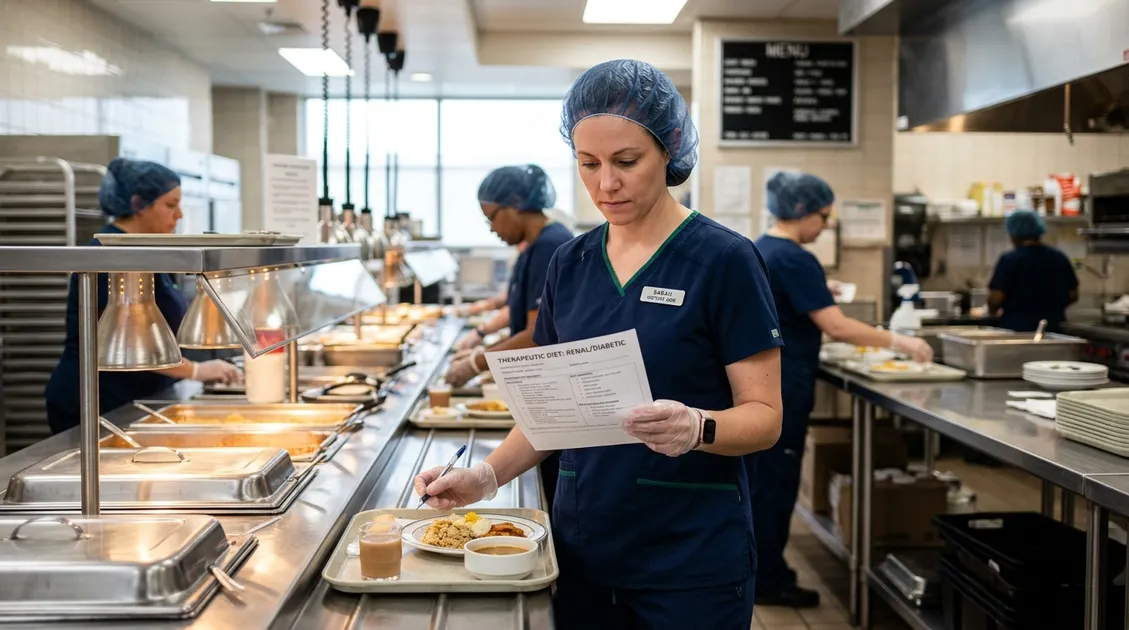
Cooks fill out three groups of fields every shift: verified census and diet counts before production, final cooking and 135°F-plus holding temperatures before service, and tray counts, leftovers, and substitutions after service, each with initials and a clock time. PantryTec recommends filling the fields in the order the shift happens, so each sheet reads top to bottom like the workday itself. Food safety entries follow FDA Food Code limits: 165°F for poultry, 155°F for ground meats, 145°F for whole-muscle cuts, and 135°F or higher for hot holding. Blank fields speak loudest during a survey, because an empty temperature line reads as a temperature nobody checked. Initials turn a form into an accountable record, and state surveyors interview dietary staff about exactly these procedures. The shift ends when the cook signs the last line, not when the last tray leaves.

Morning Census and Diet Roster Verification
Morning census entries rely on the official daily count provided by nursing, categorized by therapeutic diet orders and texture modifications. Because resident headcounts shift daily through hospital transfers, room changes, bed holds, and new NPO orders, prepping from yesterday’s roster directly causes tray-line shortages or costly overproduction.
Pre-Service Internal Cooking and Holding Temperatures
Final cook temperatures go on the sheet as product leaves the oven (§3-401.11), with the clock time; hot-holding readings follow at service (§3-501.16). Residents count as a highly susceptible population, so raw-egg recipes use pasteurized eggs (§3-801.11).
Post-Service Tray Counts and Waste Recording
Tray counts by diet close the loop against the morning census, and discard counts feed plate waste and leftover cost tracking. I treat the discard column as the most honest number on the sheet. I also prefer a crossed-out number with initials to a spotless sheet filled in at 3 p.m.
Which Portion Control Scoops and Dishers Guarantee Diet Accuracy?
Portion control dishers guarantee diet accuracy because the number equals scoops per quart: a #8 holds 1/2 cup (4 fl oz), a #12 holds 1/3 cup (2.7 fl oz), and a #16 holds 1/4 cup (2 fl oz) when leveled. PantryTec menus specify a portion size for every item, and the disher turns that size into one repeatable tray-line motion. Cooks check any scoop with one formula: 32 divided by the disher number equals its capacity in fluid ounces. Consistent carbohydrate diets depend on that precision, because 1/3 cup of cooked rice or pasta, one level #12 scoop, counts as one 15-gram carbohydrate choice. According to Washington State’s Senior Nutrition Program Standards, the per-meal cost charged to Medicaid must not exceed the cost charged to other funding sources, a limit that uncontrolled portions put at risk.

Disher Number to Volume Conversion Chart
| Disher (common handle color) | Volume (fl oz) | Diet use |
|---|---|---|
| #6 White | 2/3 cup (5.3) | Entrée casseroles |
| #8 Gray | 1/2 cup (4.0) | Vegetables, starches, purees (per recipe) |
| #10 Ivory | About 3/8 cup (3.2) | Minced entrées (per recipe) |
| #12 Green | 1/3 cup (2.7) | 15 g carb of rice or pasta |
| #16 Blue | 1/4 cup (2.0) | Sandwich fillings, cottage cheese |
| #30 Black | About 2 Tbsp (1.1) | Condiments, peanut butter |
Measuring Pureed and Mechanical Soft Textures
Pureed portions (IDDSI Level 4) take their disher from the puree recipe, since added liquid raises serving volume. Mechanical soft orders usually map to IDDSI Level 5 Minced & Moist, with particles of 4 mm or less. Weigh the first two scoops and log the weight; PantryTec’s puree IDDSI Level 4 menus and minced and moist Level 5 menus carry texture-specific recipes.

How Should Kitchen Staff Document Leftovers and Menu Substitutions?
Kitchen staff document leftovers by logging the item, quantity, and clock time as cooling starts, confirming 70°F within 2 hours and 41°F within a total cumulative time of 6 hours. They record every substitution the same day with the date, meal, planned item, and served item. PantryTec recommends closing every production sheet with these entries, because the bottom of the sheet is where the shift ends. Cooled leftovers get a use-by date no later than 7 days at 41°F or below, counting the day of preparation as day 1 (FDA Food Code §3-501.17). Reheated leftovers must reach 165°F within 2 hours before they return to hot holding (§3-403.11). According to Washington State’s Senior Nutrition Program Standards, providers must record daily participation counts, and leftover reconciliation is the kitchen’s matching count: portions produced minus trays served equals the quantity the leftover log must explain.
Two-Stage Cooling Time and Temperature Rules
135°F to 70°F within 2 hours
70°F to 41°F within 4 additional hours (6 hours total)
Log a temperature and clock time at each checkpoint (FDA Food Code §3-501.14). If food misses 70°F at 2 hours, reheat it to 165°F and restart cooling, or discard it. To pass audits reliably, kitchen staff should use shallow metal pans (2 inches deep or less), ice wands, or blast chillers to ensure food reaches the 41°F safe zone within the cumulative 6-hour limit.
Same-Day Substitution Logging for Survey Readiness
Illinois nursing home rules list the fields: date, meal, menu as written, and menu as served (77 Ill. Adm. Code 300.2080). A March 2024 Indiana survey cited F803 after a facility failed to follow the menu for 5 of 5 residents reviewed. I tell dietary managers that an unlogged swap looks like an unfollowed menu to a surveyor.
Key Takeaways for Flawless Kitchen Production Sheet Records
- Scaling factor = target portions ÷ base yield, so 64 residents on a 50-portion recipe run at 1.28.
- Disher number = scoops per quart: #8 is 1/2 cup, #12 is 1/3 cup, and #16 is 1/4 cup.
- Cooling logs need two checkpoints: 70°F within 2 hours and 41°F within 6 cumulative hours.
- At a 19.5% margin (California HealthCare Foundation 60-unit profile), $180 a year for PantryTec Starter beats $2,160 to $3,600 for per-resident software.
Your dietary production sheet template, with the math done
PantryTec pairs dietitian-approved cycle menus with pre-calculated production sheets, recipes, and grocery lists. No long-term contracts, no per-bed fees.
Frequently Asked Questions About Kitchen Production Sheets
What is a cook-to-census production sheet?
A cook-to-census production sheet is the daily kitchen record that scales each recipe to the current resident count and documents portions, temperatures, leftovers, and substitutions.
How do you calculate recipe yields for a changing daily census?
Divide today’s portion count by the base yield and multiply each ingredient by the result: 64 portions on a 50-portion recipe is 1.28. Recalculate with every census change, since the California HealthCare Foundation profile shows 50% annual turnover.
What disher size should be used for standardized 1/2 cup vegetable portions?
Use a #8 disher, which holds 1/2 cup (4 fl oz) when leveled. Pureed or minced vegetables follow their texture-modified recipe instead.
Does CMS F-Tag F803 require food production sheets?
F803 never names production sheets, but 42 CFR §483.60(c) requires menus that are prepared in advance and followed, and a completed sheet is the most direct proof a kitchen has.
How long must a care facility retain completed kitchen production sheets?
No federal rule sets one; state codes set the floor, such as 30 days for menus as served in Illinois nursing homes and California RCFEs with 16 or more residents. PantryTec recommends 15 months, the maximum interval between standard CMS nursing home surveys (42 CFR §488.308).
Pen-ready production sheets, every meal.